vĩnh0902
Active Member
- 2,216
- 1,800
Win rùi, ma kẹt no nê rồi, ko thèm thịt mình nữa

hehe chúc mưng bac nha 


Win rùi, ma kẹt no nê rồi, ko thèm thịt mình nữa
Làm lại từ đầu, vẫn 5 level như cái bảng hôm kia mình đã post, hy vọng tk lần này sống hết năm 2020hehe chúc mưng bac nha
keke dài hạn thê bác. e chỉ mong la e k cháy trong 1 tuần thôiLàm lại từ đầu, vẫn 5 level như cái bảng hôm kia mình đã post, hy vọng tk lần này sống hết năm 2020
Keke, chuỗi loss 5 level dễ gặp vậy thì chiến lược này cùi bắp roài, cháy trong 1 tuần thì phải thay chiến lược thôi, mà con woodies này duy trì phong độ rất tốt, tín tưởng em nókeke dài hạn thê bác. e chỉ mong la e k cháy trong 1 tuần thôi
hehe 2 tháng thì chưa có chuỗi loss 5 cứ đủ vốn đi 5 lệnh là ok bacs nhỉKeke, chuỗi loss 5 level dễ gặp vậy thì chiến lược này cùi bắp roài, cháy trong 1 tuần thì phải thay chiến lược thôi, mà con woodies này duy trì phong độ rất tốt, tín tưởng em nó
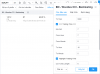
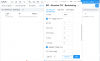
mà cái code mới post lạ thế. thay đổi thời gian bắt đầu từ 7h thành 9h lại nhiều lệnh hơnhehe 2 tháng thì chưa có chuỗi loss 5 cứ đủ vốn đi 5 lệnh là ok bacs nhỉ
e vua test lai e thay ít lệnh đi mà bác đâu có nhiều lên đâu amà cái code mới post lạ thế. thay đổi thời gian bắt đầu từ 7h thành 9h lại nhiều lệnh hơn
ơ kì z của e đâu có z đâuNó nè. Số 1 là 7h, số 2 là 9h
ko những tăng lệnh mà còn tăng hiệu suất, đúng ngược đờiơ kì z của e đâu có z đâu
bác thử xoá code đi paste lại xemko những tăng lệnh mà còn tăng hiệu suất, đúng ngược đời
1 lệnh loss thôi chứ nhỉ, mình đang ở loss level 2 nèloss 2 lệnh liên tiếp r huhu
Ko có gì khó hiểu đâu, code đó khi có tín hiệu thì nó truy ngược 6 nến trước xem có lệnh đang mở ko, nếu có lệnh đang mở thì nó bỏ qua tín hiệu đó ko vào lệnh, nếu theo dõi chart bạn sẽ thấy script thông báo có signal nhưng ko có tín hiệu macro lẫn thực thi lệnh.nó vẫn vậy à
cái lệnh bác win e vào sau nên loss huhu1 lệnh loss thôi chứ nhỉ, mình đang ở loss level 2 nè
// BO - Woodies CCI - Backtesting
// © inno14
//@version=4
strategy("BO - Woodies CCI - Backtesting")
//strategy.risk.max_intraday_loss(1, strategy.cash)
// === INPUT PERIOD OF TIME ===
Date   = input(true, title = "=== Date Option ===")
FromDay   = input(defval = 1, title = "From Day", minval = 1, maxval = 31)
FromMonth = input(defval = 1, title = "From Month", minval = 1, maxval = 12)
FromYear  = input(defval = 2020, title = "From Year", minval = 2017)

ToDay     = input(defval = 1, title = "To Day", minval = 1, maxval = 31)
ToMonth   = input(defval = 1, title = "To Month", minval = 1, maxval = 12)
ToYear    = input(defval = 9999, title = "To Year", minval = 2017)

// === DATE RANGE ===
start     = timestamp(FromYear, FromMonth, FromDay, 00, 00)  // backtest start window
finish    = timestamp(ToYear, ToMonth, ToDay, 23, 59)        // backtest finish window
window()  => time >= start and time <= finish ? true : false // create function "within window of time"

// === Trading Time ===
CTimeDvM   = input(true, title = "=== Trading Time ===")
Time_zone = input(7,title="Time Zone")
FromHourDvM   = input(defval = 07, title = "From Hour", minval = 00, maxval = 23)
FromMinuteDvM = input(defval = 30, title = "From Minute", minval = 00, maxval = 59)
ToHourDvM   = input(defval = 18, title = "To Hour", minval = 00, maxval = 23)
ToMinuteDvM = input(defval = 00, title = "To Minute", minval = 00, maxval = 59)

GMT_FHDvM=FromHourDvM<Time_zone?FromHourDvM-Time_zone+24:FromHourDvM-Time_zone
GMT_THDvM=ToHourDvM<Time_zone?ToHourDvM-Time_zone+24:ToHourDvM-Time_zone
fhDvM= (GMT_FHDvM<10?"0"+tostring(GMT_FHDvM):tostring(GMT_FHDvM))
fmDvM= (FromMinuteDvM<10?"0"+tostring(FromMinuteDvM):tostring(FromMinuteDvM))
thDvM= (GMT_THDvM<10?"0"+tostring(GMT_THDvM):tostring(GMT_THDvM))
tmDvM= (ToMinuteDvM<10?"0"+tostring(ToMinuteDvM):tostring(ToMinuteDvM))
WorkingHourDvM = fhDvM+fmDvM+"-"+thDvM+tmDvM
t0_DvM = time(timeframe.period, WorkingHourDvM)
htrtime = input(true,title="Highlight Trading Time")
bgcolor(htrtime? t0_DvM? color.gray : na:na, title="Trading Time", transp=90)

//

//Woodies CCI
cciTurboLength = input(title="CCI Turbo Length", type=input.integer, defval=6, minval=3, maxval=1400)
cci14Length = input(title="CCI 14 Length", type=input.integer, defval=14, minval=7, maxval=2000)

source = close
cciTurbo = cci(source, cciTurboLength)
cci14 = cci(source, cci14Length)

last5IsDown = cci14[5] < 0 and cci14[4] < 0 and cci14[3] < 0 and cci14[2] < 0 and cci14[1] < 0
last5IsUp = cci14[5] > 0 and cci14[4] > 0 and cci14[3] > 0 and cci14[2] > 0 and cci14[1] > 0
histogramColor = last5IsUp ? color.green : last5IsDown ? color.red : cci14 < 0 ? color.gray : color.gray

//Plot Woodies CCI
plot(cci14, title="CCI Histogram", color=histogramColor, style=plot.style_histogram, linewidth=2, transp=40)
plot(0, title="Zero Line", color=cciTurbo>100?color.blue:cciTurbo<-100?color.red:color.navy, style=plot.style_line, linewidth=6, transp=20)
hline(200, title="Hundred Line", color=color.black, linestyle=hline.style_dotted)
hline(-200, title="Minus Line", color=color.black, linestyle=hline.style_dotted)

//Plot lingreg CCI14
linreg_cci14=linreg(cci14, 5, 0)
plot(linreg_cci14, color=color.aqua, linewidth=4)

//
ext_linreg=input(150,title="Extreme Level")

//peak & top
peak_cci=
       linreg_cci14[2]>linreg_cci14[3] and linreg_cci14[1]>linreg_cci14[2] and linreg_cci14[0]<linreg_cci14[1] and linreg_cci14[1]>ext_linreg
bott_cci=
       linreg_cci14[2]<linreg_cci14[3] and linreg_cci14[1]<linreg_cci14[2] and linreg_cci14[0]>linreg_cci14[1] and linreg_cci14[1]<-ext_linreg
peak_cci_1=
       linreg_cci14[2]>linreg_cci14[3] and linreg_cci14[1]>linreg_cci14[2] and linreg_cci14[0]<linreg_cci14[1]
bott_cci_1=
       linreg_cci14[2]<linreg_cci14[3] and linreg_cci14[1]<linreg_cci14[2] and linreg_cci14[0]>linreg_cci14[1]

//
fil_len=input(6,title="Filter Length")
top_ext=highest(linreg_cci14,fil_len)
bot_ext=lowest(linreg_cci14,fil_len)

//Put signal
x1=
       peak_cci
       and linreg_cci14[1]==top_ext
       and linreg_cci14[1]>valuewhen(peak_cci_1,linreg_cci14[1],1)
       and close>low[1]
       and cciTurbo<100
       and cci14<linreg_cci14


//Call signal
y1=
       bott_cci
       and linreg_cci14[1]==bot_ext
       and linreg_cci14[1]<valuewhen(bott_cci_1,linreg_cci14[1],1)
       and close<high[1]
       and cciTurbo>-100
       and cci14>linreg_cci14


no_orders =
       not strategy.opentrades

//Function
xTech=
       x1
       and no_orders


yTech=
       y1
       and no_orders


//Plot Analyzing Signals
//hline1=hline(-1.2*300)
hline2=hline(-1.6*300)
hline0=hline(0)
sigtext=
       xTech?"Put signal":yTech?"Call signal":
       "Backtesting From: "+tostring(FromDay)+"/"+tostring(FromMonth)+"/"+tostring(FromYear)+" To: "+tostring(ToDay)+"/"+tostring(ToMonth)+"/"+tostring(ToYear)
       + " * Trading Time From: "+tostring(FromHourDvM)+":"+tostring(FromMinuteDvM)+" To "+tostring(ToHourDvM)+":"+tostring(ToMinuteDvM)
sig_col=xTech?color.new(color.red,10):yTech?color.new(color.blue,10):color.new(color.navy,10)
label_sig_text = label.new(bar_index[0], -1.5*300, text=sigtext, style=label.style_none, textcolor=sig_col, size=size.large)
label.delete(label_sig_text[1])

//plot Signal
putcol = xTech? color.red : na
callcol = yTech? color.blue : na
PutSignal= xTech and window() and t0_DvM?-1.2*300:na
CallSignal= yTech and window() and t0_DvM?-1.2*300:na

//plot(PutSignal, title='Put Signal', style=plot.style_columns, color=color.red, offset=1, transp=0)
//plot(CallSignal, title='Call Signal', style=plot.style_columns, color=color.blue, offset=1, transp=0)
plotshape(PutSignal, title='Put', text="Put", style=shape.circle, location=location.absolute, color=color.red, textcolor=color.black, offset=1, transp=0, size=size.large)
plotshape(CallSignal, title='Call', text="Call", style=shape.circle, location=location.absolute, color=color.blue, textcolor=color.black, offset=1, transp=0, size=size.large)
//plotchar(PutSignal, title='Put', char="◉", text="Put", location=location.absolute, color=color.red, textcolor=color.black, offset=1, transp=0, size=size.small)
//plotchar(CallSignal, title='Call', char="◉", text="Call", location=location.absolute, color=color.blue, textcolor=color.black, offset=1, transp=0, size=size.small)

//Backtesting
exp_tt=input(true,"Expiry Option By Bars")
exp_val=input(3,"Number of Bars")
strategy.entry("Call", strategy.long, when=yTech and window() and t0_DvM)
strategy.entry("Put", strategy.short, when=xTech and window() and t0_DvM)
strategy.close_all(when=barssince(xTech)==exp_val or barssince(yTech)==exp_val)
//EOFHình như macro ngó chart mà Tradingview chưa nhả tín hiệu thì phảisao giống e thê hic e vào muon 2p 2p cuối nó lên như điên nhìn muốn đập máy luôn ý
We get it, advertisements are annoying!
Sure, ad-blocking software does a great job at blocking ads, but it also blocks useful features of our website. For the best site experience please disable your AdBlocker.
Tất cả nội dung trên website này đều vì mục đích cung cấp thông tin và không phải lời khuyên đầu tư.
Tại Việt Nam, giao dịch CFD forex có các rủi ro nhất định, trong đó bao gồm rủi ro về pháp lý. Độc giả nên tìm hiểu kỹ trước khi đưa ra quyết định tham gia.