Trương Nhật
Active Member
- 665
- 754
cũng đang mong đợi nè, hehekeke thì đợi hết tuần này coi hieu suất thang 12 bản v1.2 the nào hjhj đang 61% mà cần 9% nữa là đủ kaka


cũng đang mong đợi nè, hehekeke thì đợi hết tuần này coi hieu suất thang 12 bản v1.2 the nào hjhj đang 61% mà cần 9% nữa là đủ kaka
Vậy 1.2 đang là chén nhựa cao cấp rồihiệu suất bản v2.1
tháng 11

tháng 12
")
song kiếm hợp bích là 1 ý tưởng tuyệt vờiMà ma trận phân kỳ 1.2 và 2.1 hoàn toàn giống nhau về thuật toán phân kỳ, chỉ khác về thuật toán volume, nên @vĩnh0902 xem xem các lệnh của 2 bộ này nó thế nào, trùng nhau nhiều ko, có mâu thuẫn ko, mình đang ủ mưu song kiếm hợp bích đây, kaka
Nhờ bạn @anhnguyen14 hộ mình chiến lược này để backtest xem saoanh em dùng thử xem nó chạy thế nào, phản hồi giúp mình nha, này chỉ là indi như cái đồng hồ kia thôi, chưa có chiến lược nha, anh em thấy hay thì phản hồi để mình tiến hành xây chiến lược sau ha
Mã://@version=4 study(title = "Technical Analysis Summary") //@version=4 //Technical Analysis Summary //author: anhnguyen14 //A. Oscillators //1. Rsi RSI(src,per) => len = per up = rma(max(change(src), 0), len) down = rma(-min(change(src), 0), len) rsi = down == 0 ? 100 : up == 0 ? 0 : 100 - 100 / (1 + up / down) RSI=rsi rsi_Sig=RSI(close,14) //RSI Signal A1_red = rsi_Sig<30 ?1:0 A1_blue = rsi_Sig>70 ?1:0 //2. Stochastic STOCH(src,perK,perD,perS) => K = perK D = perD smooth = perS hh = highest(high, K) ll = lowest(low, K) k = sma((src - ll) / (hh - ll) * 100, smooth) d = sma(k, D) STOCH=k stoch_Sig = STOCH(close,14,3,3) //plot(stoch_Sig,color=color.green) //STOCH Signal A2_red = stoch_Sig<20 ?1:0 A2_blue = stoch_Sig>80 ?1:0 //3. CCI CCI(src,per) => lengthcci1 = per macci1 = sma(src, lengthcci1) cci1 = (src - macci1) / (0.015 * dev(src, lengthcci1)) CCI = cci1 cci_Sig=CCI(close,20) //plot(cci_Sig,color=color.blue) //CCI Signal A3_red = cci_Sig<-100 ?1:0 A3_blue = cci_Sig>100 ?1:0 //4. ADX adxlen = 14 dilen = 14 dirmov(len) => up = change(high) down = -change(low) truerange = rma(tr, len) plus = fixnan(100 * rma(up > down and up > 0 ? up : 0, len) / truerange) minus = fixnan(100 * rma(down > up and down > 0 ? down : 0, len) / truerange) [plus, minus] adx(dilen, adxlen) => [plus, minus] = dirmov(dilen) sum = plus + minus adx = 100 * rma(abs(plus - minus) / (sum == 0 ? 1 : sum), adxlen) adxHigh(dilen, adxlen) => [plus, minus] = dirmov(dilen) plus adxLow(dilen, adxlen) => [plus, minus] = dirmov(dilen) minus adx_Sig = adx(dilen, adxlen) di_sigHigh = adxHigh(dilen, adxlen) di_sigLow = adxLow(dilen, adxlen) //plot(adx_Sig) //ADX Signal A4_red = di_sigLow>di_sigHigh and adx_Sig>25 ?1:0 A4_blue = di_sigHigh>di_sigLow and adx_Sig>25 ?1:0 //5. AO ao = sma(hl2,5) - sma(hl2,34) //AO Signal A5_red = ao<0 ?1:0 A5_blue = ao>0 ?1:0 //6. momentum mom = close - close[10] //momentum Signal A6_red = mom<0 ?1:0 A6_blue = mom>0 ?1:0 //7. MACD fast_ma = ema(close, 12) slow_ma = ema(close, 26) macd = fast_ma - slow_ma signal = ema(macd, 9) hist = macd - signal //MACD Signal A7_red = hist < hist[1] ?1:0 A7_blue = hist > hist[1] ?1:0 //8. Stoch RSI rsi1 = rsi(close, 14) rsik = sma(stoch(rsi1, rsi1, rsi1, 14), 3) rsid = sma(rsik, 3) rsih0 = 80 rsih1 = 20 //Stoch RSI Signal A8_red = rsik < rsih1 ?1:0 A8_blue = rsik > rsih0 ?1:0 //9. %R upper = highest(14) lower = lowest(14) out = 100 * (close - upper) / (upper - lower) rband1 = -20 rband0 = -80 // %R Signal A9_red = out < rband0 ?1:0 A9_blue = out > rband1 ?1:0 //10. Bull bear Length = 30 r1=iff(close[1]<open,max(open-close[1],high-low),high-low) r2=iff(close[1]>open,max(close[1]-open,high-low),high-low) bull=iff(close==open,iff(high-close==close-low,iff(close[1]>open,max(high-open,close-low),r1),iff(high-close>close-low,iff(close[1]<open, max(high-close[1],close-low), high-open),r1)),iff(close<open,iff(close[1]<open,max(high-close[1],close-low), max(high-open,close-low)),r1)) bear=iff(close==open,iff(high-close==close-low,iff(close[1]<open,max(open-low,high-close),r2),iff(high-close>close-low,r2,iff(close[1]>open,max(close[1]-low,high-close), open-low))),iff(close<open,r2,iff(close[1]>open,max(close[1]-low,high-close),max(open-low,high-close)))) // Bull bear Signal A10_red = sma(bull-bear,Length)<0 ?1:0 A10_blue = sma(bull-bear,Length)>0 ?1:0 //11.UO length7 = 7, length14 = 14, length28 = 28 average(bp, tr_, length) => sum(bp, length) / sum(tr_, length) high_ = max(high, close[1]) low_ = min(low, close[1]) bp = close - low_ tr_ = high_ - low_ avg7 = average(bp, tr_, length7) avg14 = average(bp, tr_, length14) avg28 = average(bp, tr_, length28) uoout = 100 * (4*avg7 + 2*avg14 + avg28)/7 // UO Signal A11_red = uoout < 30 ?1:0 A11_blue = uoout > 70 ?1:0 //Sum Signal A A_red = A1_red + A2_red + A3_red + A4_red + A5_red + A6_red + A7_red + A8_red + A9_red + A10_red + A11_red A_blue = A1_blue + A2_blue + A3_blue + A4_blue + A5_blue + A6_blue + A7_blue + A8_blue + A9_blue + A10_blue + A11_blue //B. Moving Averages //1. EMA 5 B1_red = close<ema(close,5) ?1:0 B1_blue = close>ema(close,5) ?1:0 //2. SMA 5 B2_red = close<sma(close,5) ?1:0 B2_blue = close>sma(close,5) ?1:0 //3. EMA 10 B3_red = close<ema(close,10) ?1:0 B3_blue = close>ema(close,10) ?1:0 //4. SMA 10 B4_red = close<sma(close,10) ?1:0 B4_blue = close>sma(close,10) ?1:0 //5. EMA 20 B5_red = close<ema(close,20) ?1:0 B5_blue = close>ema(close,20) ?1:0 //6. SMA 20 B6_red = close<sma(close,20) ?1:0 B6_blue = close>sma(close,20) ?1:0 //7. EMA 30 B7_red = close<ema(close,30) ?1:0 B7_blue = close>ema(close,30) ?1:0 //8. SMA 30 B8_red = close<sma(close,30) ?1:0 B8_blue = close>sma(close,30) ?1:0 //9. EMA 50 B9_red = close<ema(close,50) ?1:0 B9_blue = close>ema(close,50) ?1:0 //10. SMA 50 B10_red = close<sma(close,50) ?1:0 B10_blue = close>sma(close,50) ?1:0 //11. EMA 100 B11_red = close<ema(close,100) ?1:0 B11_blue = close>ema(close,100) ?1:0 //12. SMA 100 B12_red = close<sma(close,100) ?1:0 B12_blue = close>sma(close,100) ?1:0 //13. EMA 200 B13_red = close<ema(close,200) ?1:0 B13_blue = close>ema(close,200) ?1:0 //14. SMA 200 B14_red = close<sma(close,200) ?1:0 B14_blue = close>sma(close,200) ?1:0 //15. Ichimoku Cloud - Baseline donchian(len) => avg(lowest(len), highest(len)) ichi_baseline = donchian(26) B15_red = close<ichi_baseline ?1:0 B15_blue = close>ichi_baseline ?1:0 //16. VWMA 20 B16_red = close<vwma(close,20) ?1:0 B16_blue = close>vwma(close,20) ?1:0 //17. Hull 9 hma(src,len) => wma(2*wma(src, len/2)-wma(src, len), round(sqrt(len))) B17_red = close<hma(close,9) ?1:0 B17_blue = close>hma(close,9) ?1:0 //Sum Signal B B_red = B1_red + B2_red + B3_red + B4_red + B5_red + B6_red + B7_red + B8_red + B9_red + B10_red + B11_red + B12_red + B13_red + B14_red + B15_red + B16_red + B17_red B_blue = B1_blue + B2_blue + B3_blue + B4_blue + B5_blue + B6_blue + B7_blue + B8_blue + B9_blue + B10_blue + B11_blue + B12_blue + B13_blue + B14_blue + B15_blue + B16_blue + B17_blue //C. Pivot /////////////// // FUNCTIONS // /////////////// // Function outputs 1 when it's the first bar of the D/W/M/Y is_newbar(res) => ch = 0 if(res == 'Y') t = year(time('D')) ch := change(t) != 0 ? 1 : 0 else t = time(res) ch := change(t) != 0 ? 1 : 0 ch // Rounding levels to min tick nround(x) => n = round(x / syminfo.mintick) * syminfo.mintick //////////// // INPUTS // //////////// pp_res = 'D' ///////////////////// // Get HLC from HT // // Calc Open open_cur = 0.0 open_cur := is_newbar(pp_res) ? open : open_cur[1] popen = 0.0 popen := is_newbar(pp_res) ? open_cur[1] : popen[1] // Calc High high_cur = 0.0 high_cur := is_newbar(pp_res) ? high : max(high_cur[1], high) phigh = 0.0 phigh := is_newbar(pp_res) ? high_cur[1] : phigh[1] // Calc Low low_cur = 0.0 low_cur := is_newbar(pp_res) ? low : min(low_cur[1], low) plow = 0.0 plow := is_newbar(pp_res) ? low_cur[1] : plow[1] // Calc Close pclose = 0.0 pclose := is_newbar(pp_res) ? close[1] : pclose[1] //////////////////////////// // CALCULATE PIVOT POINTS // //////////////////////////// PP = 0.0 R1 = 0.0, R2 = 0.0, R3 = 0.0 S1 = 0.0, S2 = 0.0, S3 = 0.0 //if (pp_type == "Traditional") TR_PP = (phigh + plow + pclose) / 3 TR_R1 = TR_PP + (TR_PP - plow) TR_S1 = TR_PP - (phigh - TR_PP) TR_R2 = TR_PP + (phigh - plow) TR_S2 = TR_PP - (phigh - plow) TR_R3 = phigh + 2 * (TR_PP - plow) TR_S3 = plow - 2 * (phigh - TR_PP) //Signal C1_red = (close>TR_R1) or (close>TR_R2) or (close>TR_R3) ?1:0 C1_blue = (close<TR_S1) or (close<TR_S2) or (close<TR_S3) ?1:0 //if (pp_type == "Fibonacci") FIB_PP = (phigh + plow + pclose) / 3 FIB_R1 = FIB_PP + (phigh - plow) * 0.382 FIB_S1 = FIB_PP - (phigh - plow) * 0.382 FIB_R2 = FIB_PP + (phigh - plow) * 0.618 FIB_S2 = FIB_PP - (phigh - plow) * 0.618 FIB_R3 = FIB_PP + (phigh - plow) * 1.000 FIB_S3 = FIB_PP - (phigh - plow) * 1.000 C2_red = (close>FIB_R1) or (close>FIB_R2) or (close>FIB_R3) ?1:0 C2_blue = (close<FIB_S1) or (close<FIB_S2) or (close<FIB_S3) ?1:0 //if (pp_type == "Woodie") WO_PP = (phigh + plow + 2 * popen) / 4 WO_R1 = WO_PP + (WO_PP - plow) WO_S1 = WO_PP - (phigh - WO_PP) WO_R2 = WO_PP + (phigh - plow) WO_S2 = WO_PP - (phigh - plow) WO_R3 = phigh + 2 * (WO_PP - plow) WO_S3 = plow - 2 * (phigh - WO_PP) C3_red = (close>WO_R1) or (close>WO_R2) or (close>WO_R3) ?1:0 C3_blue = (close<WO_S1) or (close<WO_S2) or (close<WO_S3) ?1:0 //if (pp_type == "Camarilla") CA_PP = (phigh + plow + pclose) / 3 CA_R1 = pclose + (phigh - plow) * 1.1/12 CA_S1 = pclose - (phigh - plow) * 1.1/12 CA_R2 = pclose + (phigh - plow) * 1.1/6 CA_S2 = pclose - (phigh - plow) * 1.1/6 CA_R3 = pclose + (phigh - plow) * 1.1/4 CA_S3 = pclose - (phigh - plow) * 1.1/4 C4_red = cross(close,CA_R1) or cross(close,CA_R2) or cross(close,CA_R3) ?1:0 C4_blue = cross(close,CA_S1) or cross(close,CA_S2) or cross(close,CA_S3) ?1:0 //C Point C_red = C1_red + C2_red + C3_red + C4_red C_blue = C1_blue + C2_blue + C3_blue + C4_blue //Sum point Sum_red=A_red+B_red+C_red Sum_blue=A_blue+B_blue+C_blue sell_point=(Sum_red/32)*100 buy_point=(Sum_blue/32)*100 //Signal Level Neu= sell_point<55 and buy_point<55 Sell= sell_point[1]>55 and sell_point>60 StrongSell= sell_point[1]<55 and sell_point>60 Buy= buy_point[1]>55 and buy_point>60 StrongBuy= buy_point[1]<55 and buy_point>60 //Plot Signal col_Neutral=color.new(color.gray,50) col_Sell=color.new(color.red,50) col_Strong_Sell=color.new(color.red,20) col_Buy=color.new(color.blue,50) col_Strong_Buy=color.new(color.blue,20) plot(-sell_point, title="Sell Points", color=StrongSell?col_Strong_Sell:Sell?col_Sell:col_Neutral, style=plot.style_columns) plot(buy_point, title="Buy Points", color=StrongBuy?col_Strong_Buy:Buy?col_Buy:col_Neutral, style=plot.style_columns) hblue=hline(80) hred=hline(-80) hzr=hline(0) //Plot Label lab_Neu= Neu ?-5:na lab_Sell= Sell ?10:na lab_StrongSell= StrongSell ?20:na lab_Buy= Buy ?-10:na lab_StrongBuy= StrongBuy ?-20:na plotshape(lab_Neu, title='Neutral', text="Neutral", style=shape.labeldown, location=location.absolute, color=color.orange, textcolor=color.black, offset=0, transp=0, show_last=2) plotshape(lab_Sell, title='Sell', text="Sell", style=shape.labeldown, location=location.absolute, color=color.orange, textcolor=color.black, offset=0, transp=0, show_last=2) plotshape(lab_StrongSell, title='Strong Sell', text="Strong Sell", style=shape.labeldown, location=location.absolute, color=color.orange, textcolor=color.black, offset=0, transp=0, show_last=2) plotshape(lab_Buy, title='Buy', text="Buy", style=shape.labelup, location=location.absolute, color=color.orange, textcolor=color.black, offset=0, transp=0, show_last=2) plotshape(lab_StrongBuy, title='Strong Buy', text="Strong Buy", style=shape.labelup, location=location.absolute, color=color.orange, textcolor=color.black, offset=0, transp=0, show_last=2) //EOF
e nghĩ k song kiếm hợp bích đk bác ạ tuy e k thống kê nhưng 2/3 lệnh là trùng lệnh của bản v1.2song kiếm hợp bích là 1 ý tưởng tuyệt vời
vậy có thể dùng để so sánh lệnhe nghĩ k song kiếm hợp bích đk bác ạ tuy e k thống kê nhưng 2/3 lệnh là trùng lệnh của bản v1.2
Rule này ngay chỗ dao động hẹp ấy nó trừu tượng quá, máy nó ko hiểu đâu, những chiến lược mang tính đánh giá chủ quan phải dựa vào kinh nghiệm quan sát chart để đánh chứ ko nên code thành tín hiệu 0110. Một chiến lược muốn code được nó phải khách quan bằng những con số ấyNhờ bạn @anhnguyen14 hộ mình chiến lược này để backtest xem sao
Stoch đi trên vùng OB/OS lớn hơn 12 nếnRule này ngay chỗ dao động hẹp ấy nó trừu tượng quá, máy nó ko hiểu đâu, những chiến lược mang tính đánh giá chủ quan phải dựa vào kinh nghiệm quan sát chart để đánh chứ ko nên code thành tín hiệu 0110. Một chiến lược muốn code được nó phải khách quan bằng những con số ấy
Ok, thông số của stoch là mấy vậy bạnStoch đi trên vùng OB/OS lớn hơn 12 nến
Nhưng hiệu suất không hấp dẫn lắm2 tháng nè bác ơi hjhj nhiều lệnh hơn bác ạ
tháng11
hjhj hơn 20 lệnh nhưng hiệu suất giảm chút ít k sao ... keke hnay thị trường k mở cửa sao IDC vẫn chạy z bác phân kì nổ 3 lossNhưng hiệu suất không hấp dẫn lắm
Phân kỳ nổ muốn chuẩn phải có volume, hôm nay nghỉ lễ các sàn giao dịch ngoại hối nghỉ nên volume giao dịch thấp thì nó nổ bậy rồi, nhưng cũng chẳng ảnh hưởng vì có vào được lệnh đâuhjhj hơn 20 lệnh nhưng hiệu suất giảm chút ít k sao ... keke hnay thị trường k mở cửa sao IDC vẫn chạy z bác phân kì nổ 3 loss
vậy bản 1.2 đã có volume chưa bácPhân kỳ nổ muốn chuẩn phải có volume, hôm nay nghỉ lễ các sàn giao dịch ngoại hối nghỉ nên volume giao dịch thấp thì nó nổ bậy rồi, nhưng cũng chẳng ảnh hưởng vì có vào được lệnh đâu
IDC là dịch vụ dữ liệu, nó không phụ thuộc vào sàn, sàn nghỉ nhưng các ngân hàng các nước vẫn tiến hành giao dịch mà, giá vẫn lên vẫn xuống, thế mới có chuyện sau lễ sàn mở cửa giá Gap lên hoặc Gap xuống
Có chứ nhưng là thuật toán volume đơn lẻvậy bản 1.2 đã có volume chưa bác
. Bản 2.2 thêm các thuật toán nhóm volume, để lát mình gởi cho đã nhận rồi bác, tks bác, so với 1.2 trong tháng 12 thì 2.1 hơn 8 lệnh, tỷ lệ win tăng đc 1 xíuCó chứ nhưng là thuật toán volume đơn lẻ
Do bạn không ghi chi tiết các thông số nên mình code để bạn tự nhập thông số vào nhéNhờ bạn @anhnguyen14 hộ mình chiến lược này để backtest xem sao
//@version=4
//BO Backtesting HangVu02.0
//author: anhnguyen14

strategy(title="BO Backtesting HangVu 2.0", overlay=false, pyramiding=10)

// === INPUT BACKTEST RANGE ===
Date   = input(true, title = "=== Date Option ===")
FromDay   = input(defval = 1, title = "From Day", minval = 1, maxval = 31)
FromMonth = input(defval = 1, title = "From Month", minval = 1, maxval = 12)
FromYear  = input(defval = 2019, title = "From Year", minval = 2017)

ToDay     = input(defval = 1, title = "To Day", minval = 1, maxval = 31)
ToMonth   = input(defval = 1, title = "To Month", minval = 1, maxval = 12)
ToYear    = input(defval = 9999, title = "To Year", minval = 2017)

// === DATE RANGE ===
start     = timestamp(FromYear, FromMonth, FromDay, 00, 00)  // backtest start window
finish    = timestamp(ToYear, ToMonth, ToDay, 23, 59)        // backtest finish window
window()  => time >= start and time <= finish ? true : false // create function "within window of time"

// === Trading Time ===
CTimeDvM   = input(true, title = "=== Trading Time ===")
FromHourDvM   = input(defval = 05, title = "From Hour", minval = 00, maxval = 23)
FromMinuteDvM = input(defval = 00, title = "From Minute", minval = 00, maxval = 59)
ToHourDvM   = input(defval = 04, title = "To Hour", minval = 00, maxval = 23)
ToMinuteDvM = input(defval = 59, title = "To Minute", minval = 00, maxval = 59)
GMT_FHDvM=FromHourDvM<7?FromHourDvM-7+24:FromHourDvM-7
GMT_THDvM=ToHourDvM<7?ToHourDvM-7+24:ToHourDvM-7
fhDvM= (GMT_FHDvM<10?"0"+tostring(GMT_FHDvM):tostring(GMT_FHDvM))
fmDvM= (FromMinuteDvM<10?"0"+tostring(FromMinuteDvM):tostring(FromMinuteDvM))
thDvM= (GMT_THDvM<10?"0"+tostring(GMT_THDvM):tostring(GMT_THDvM))
tmDvM= (ToMinuteDvM<10?"0"+tostring(ToMinuteDvM):tostring(ToMinuteDvM))
WorkingHourDvM = fhDvM+fmDvM+"-"+thDvM+tmDvM
t0_DvM = time(timeframe.period, WorkingHourDvM)
//bgcolor(CTimeDvM? t0_DvM? color.gray : na:na, title="Trading Time", transp=90)
HVtt   = input(true, title = "=== HangVu Setup ===")
call1 = input(true, title = "1. Call")
put1 = input(true, title = "2. Put")
stchtt = input(true, title = "=== Stochastic Setup ===")
K = input(15,  title="%K", minval=1)
D = input(7, title="%D", minval=1)
smooth = input(3, minval=1)
hh = highest(high, K)
ll = lowest(low, K)
k = sma((close - ll) / (hh - ll) * 100, smooth)
d = sma(k, D)
Entry = input(true, title = "=== Entry Setup ===")
Ex_high = input(80, title="Overbought")
Ex_low = input(20, title="Oversold")
Cg = input(12, title="Bars Over")
Maxmove = input(6, title="Max Bars Before Cross 50")
//plot
up2 = d > d[1]
down2 = d < d[1]
mycolor2 = up2 ? color.green : down2 ? color.red : color.blue
plot(k, title="%K", color=mycolor2, linewidth=3)
plot(d, title="%D", color=color.aqua, linewidth=3)

h0 = hline(80)
h1 = hline(20)
h2 = hline(50)
//h3 = hline(45, color=color.red)
//h4 = hline(55, color=color.green)
fill(h0, h1, color=color.gray, transp=95)

//Stoch over
c=Cg-1
k1=0
for i=0 to c
    k1:=k[i]>Ex_high?k1+1:k1
k2=0
for i=0 to c
    k2:=k[i]>Ex_high?k2+1:k2
kovb =
       k1==Cg


kovs =
       k2==Cg


//Case 1
//Put Condition
x1=
       put1?
       barssince(kovb)<Maxmove
       and crossunder(k,50)
       :false

//Call Condition
y1=
       call1?
       barssince(kovs)<Maxmove
       and crossover(k,50)
       :false


// - /FUNCTIONS

xDvM=
       x1


yDvM=
       y1


//--------------------------------------\\

// - /FUNCTIONS

//--------------------------------------\\

// Alert
CputcolDvM = xDvM ? color.red : na
CcallcolDvM = yDvM ? color.blue : na
plotshape(CTimeDvM?t0_DvM?xDvM:na:na, title='Put', text="Put", style=shape.labeldown, location=location.bottom, color=color.orange, textcolor=color.black, offset=1, transp=0)
plotshape(CTimeDvM?t0_DvM?yDvM:na:na, title='Call', text="Call", style=shape.labelup, location=location.bottom, color=color.orange, textcolor=color.black, offset=1, transp=0)
bgcolor(CTimeDvM?t0_DvM?CputcolDvM:na:na, transp=50, offset=1, title="Put Signal")
bgcolor(CTimeDvM?t0_DvM?CcallcolDvM:na:na, transp=50, offset=1, title="Call Signal")

//Backtesting
if (CTimeDvM)
    strategy.entry("Call", strategy.long, when=yDvM and window() and t0_DvM)
if (CTimeDvM)
    strategy.entry("Put", strategy.short, when=xDvM and window() and t0_DvM)

strategy.close_all(when=barstate.isnew)

//EOFhí hí, thanks bạn nhiềuDo bạn không ghi chi tiết các thông số nên mình code để bạn tự nhập thông số vào nhé
Mã://@version=4 //BO Backtesting HangVu02.0 //author: anhnguyen14 strategy(title="BO Backtesting HangVu 2.0", overlay=false, pyramiding=10) // === INPUT BACKTEST RANGE === Date = input(true, title = "=== Date Option ===") FromDay = input(defval = 1, title = "From Day", minval = 1, maxval = 31) FromMonth = input(defval = 1, title = "From Month", minval = 1, maxval = 12) FromYear = input(defval = 2019, title = "From Year", minval = 2017) ToDay = input(defval = 1, title = "To Day", minval = 1, maxval = 31) ToMonth = input(defval = 1, title = "To Month", minval = 1, maxval = 12) ToYear = input(defval = 9999, title = "To Year", minval = 2017) // === DATE RANGE === start = timestamp(FromYear, FromMonth, FromDay, 00, 00) // backtest start window finish = timestamp(ToYear, ToMonth, ToDay, 23, 59) // backtest finish window window() => time >= start and time <= finish ? true : false // create function "within window of time" // === Trading Time === CTimeDvM = input(true, title = "=== Trading Time ===") FromHourDvM = input(defval = 05, title = "From Hour", minval = 00, maxval = 23) FromMinuteDvM = input(defval = 00, title = "From Minute", minval = 00, maxval = 59) ToHourDvM = input(defval = 04, title = "To Hour", minval = 00, maxval = 23) ToMinuteDvM = input(defval = 59, title = "To Minute", minval = 00, maxval = 59) GMT_FHDvM=FromHourDvM<7?FromHourDvM-7+24:FromHourDvM-7 GMT_THDvM=ToHourDvM<7?ToHourDvM-7+24:ToHourDvM-7 fhDvM= (GMT_FHDvM<10?"0"+tostring(GMT_FHDvM):tostring(GMT_FHDvM)) fmDvM= (FromMinuteDvM<10?"0"+tostring(FromMinuteDvM):tostring(FromMinuteDvM)) thDvM= (GMT_THDvM<10?"0"+tostring(GMT_THDvM):tostring(GMT_THDvM)) tmDvM= (ToMinuteDvM<10?"0"+tostring(ToMinuteDvM):tostring(ToMinuteDvM)) WorkingHourDvM = fhDvM+fmDvM+"-"+thDvM+tmDvM t0_DvM = time(timeframe.period, WorkingHourDvM) //bgcolor(CTimeDvM? t0_DvM? color.gray : na:na, title="Trading Time", transp=90) HVtt = input(true, title = "=== HangVu Setup ===") call1 = input(true, title = "1. Call") put1 = input(true, title = "2. Put") stchtt = input(true, title = "=== Stochastic Setup ===") K = input(15, title="%K", minval=1) D = input(7, title="%D", minval=1) smooth = input(3, minval=1) hh = highest(high, K) ll = lowest(low, K) k = sma((close - ll) / (hh - ll) * 100, smooth) d = sma(k, D) Entry = input(true, title = "=== Entry Setup ===") Ex_high = input(80, title="Overbought") Ex_low = input(20, title="Oversold") Cg = input(12, title="Bars Over") Maxmove = input(6, title="Max Bars Before Cross 50") //plot up2 = d > d[1] down2 = d < d[1] mycolor2 = up2 ? color.green : down2 ? color.red : color.blue plot(k, title="%K", color=mycolor2, linewidth=3) plot(d, title="%D", color=color.aqua, linewidth=3) h0 = hline(80) h1 = hline(20) h2 = hline(50) //h3 = hline(45, color=color.red) //h4 = hline(55, color=color.green) fill(h0, h1, color=color.gray, transp=95) //Stoch over c=Cg-1 k1=0 for i=0 to c k1:=k[i]>Ex_high?k1+1:k1 k2=0 for i=0 to c k2:=k[i]>Ex_high?k2+1:k2 kovb = k1==Cg kovs = k2==Cg //Case 1 //Put Condition x1= put1? barssince(kovb)<Maxmove and crossunder(k,50) :false //Call Condition y1= call1? barssince(kovs)<Maxmove and crossover(k,50) :false // - /FUNCTIONS xDvM= x1 yDvM= y1 //--------------------------------------\\ // - /FUNCTIONS //--------------------------------------\\ // Alert CputcolDvM = xDvM ? color.red : na CcallcolDvM = yDvM ? color.blue : na plotshape(CTimeDvM?t0_DvM?xDvM:na:na, title='Put', text="Put", style=shape.labeldown, location=location.bottom, color=color.orange, textcolor=color.black, offset=1, transp=0) plotshape(CTimeDvM?t0_DvM?yDvM:na:na, title='Call', text="Call", style=shape.labelup, location=location.bottom, color=color.orange, textcolor=color.black, offset=1, transp=0) bgcolor(CTimeDvM?t0_DvM?CputcolDvM:na:na, transp=50, offset=1, title="Put Signal") bgcolor(CTimeDvM?t0_DvM?CcallcolDvM:na:na, transp=50, offset=1, title="Call Signal") //Backtesting if (CTimeDvM) strategy.entry("Call", strategy.long, when=yDvM and window() and t0_DvM) if (CTimeDvM) strategy.entry("Put", strategy.short, when=xDvM and window() and t0_DvM) strategy.close_all(when=barstate.isnew) //EOF
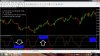
=== Ảnh minh họa ===


We get it, advertisements are annoying!
Sure, ad-blocking software does a great job at blocking ads, but it also blocks useful features of our website. For the best site experience please disable your AdBlocker.
Tất cả nội dung trên website này đều vì mục đích cung cấp thông tin và không phải lời khuyên đầu tư.
Tại Việt Nam, giao dịch CFD forex có các rủi ro nhất định, trong đó bao gồm rủi ro về pháp lý. Độc giả nên tìm hiểu kỹ trước khi đưa ra quyết định tham gia.