


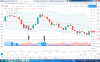
Cái cột màu xanh nó nổi bật lên làm mình ko nhìn đc cái màu còn lại trong cột đó. ko như cột màu đỏ. Mà cho em hỏi cái cột biểu thị cái gì thế bácQuà năm mới tặng anh em
Code TradingView Clock - MTF beta 3:
* Cập nhật giá trị nhận biết trend kiệt sức (điểm Buy/Sell rớt từ trên 75 xuống dưới 75 - xem như giá đã đạt target, giá chạy đã xa, hay còn gọi là trend kiệt sức bla bla... anh em gọi gì cũng được - thì lúc này indi cũng sẽ ngừng phát tín hiệu)
* Cập nhật hiển thị số điểm của Sell và Buy lên cửa sổ indicator (thang điểm 100)
=== Code ===
Mã://@version=4 //BO TradingView Clock - MTF beta 3 //author: anhnguyen14 study(title="BO TradingView Clock - MTF beta 3", shorttitle="MTF- beta 3", overlay=false) // === Signal Time === CTimeDvM = input(true, title = "=== Trading Time ===") FromHourDvM = input(defval = 5, title = "From Hour", minval = 00, maxval = 23) FromMinuteDvM = input(defval = 00, title = "From Minute", minval = 00, maxval = 59) ToHourDvM = input(defval = 04, title = "To Hour", minval = 00, maxval = 23) ToMinuteDvM = input(defval = 59, title = "To Minute", minval = 00, maxval = 59) GMT_FHDvM=FromHourDvM<7?FromHourDvM-7+24:FromHourDvM-7 GMT_THDvM=ToHourDvM<7?ToHourDvM-7+24:ToHourDvM-7 fhDvM= (GMT_FHDvM<10?"0"+tostring(GMT_FHDvM):tostring(GMT_FHDvM)) fmDvM= (FromMinuteDvM<10?"0"+tostring(FromMinuteDvM):tostring(FromMinuteDvM)) thDvM= (GMT_THDvM<10?"0"+tostring(GMT_THDvM):tostring(GMT_THDvM)) tmDvM= (ToMinuteDvM<10?"0"+tostring(ToMinuteDvM):tostring(ToMinuteDvM)) WorkingHourDvM = fhDvM+fmDvM+"-"+thDvM+tmDvM t0_DvM = time(timeframe.period, WorkingHourDvM) //bgcolor(CTimeDvM? t0_DvM? color.gray : na:na, title="Trading Time", transp=90) //A. Oscillators //1. Rsi RSI(src,per) => len = per up = rma(max(change(src), 0), len) down = rma(-min(change(src), 0), len) rsi = down == 0 ? 100 : up == 0 ? 0 : 100 - 100 / (1 + up / down) RSI=rsi rsi_Sig=RSI(close,14) //RSI Signal A1_red = rsi_Sig<30 ?1:0 A1_blue = rsi_Sig>70 ?1:0 //2. Stochastic STOCH(src,perK,perD,perS) => K = perK D = perD smooth = perS hh = highest(high, K) ll = lowest(low, K) k = sma((src - ll) / (hh - ll) * 100, smooth) d = sma(k, D) STOCH=k stoch_Sig = STOCH(close,14,3,3) //plot(stoch_Sig,color=color.green) //STOCH Signal A2_red = stoch_Sig<20 ?1:0 A2_blue = stoch_Sig>80 ?1:0 //3. CCI CCI(src,per) => lengthcci1 = per macci1 = sma(src, lengthcci1) cci1 = (src - macci1) / (0.015 * dev(src, lengthcci1)) CCI = cci1 cci_Sig=CCI(close,20) //plot(cci_Sig,color=color.blue) //CCI Signal A3_red = cci_Sig<-100 ?1:0 A3_blue = cci_Sig>100 ?1:0 //4. ADX adxlen = 14 dilen = 14 dirmov(len) => up = change(high) down = -change(low) truerange = rma(tr, len) plus = fixnan(100 * rma(up > down and up > 0 ? up : 0, len) / truerange) minus = fixnan(100 * rma(down > up and down > 0 ? down : 0, len) / truerange) [plus, minus] ADX(dilen, adxlen) => [plus, minus] = dirmov(dilen) sum = plus + minus ADX = 100 * rma(abs(plus - minus) / (sum == 0 ? 1 : sum), adxlen) adxHigh(dilen, adxlen) => [plus, minus] = dirmov(dilen) plus adxLow(dilen, adxlen) => [plus, minus] = dirmov(dilen) minus ADX_Sig = ADX(dilen, adxlen) di_sigHigh = adxHigh(dilen, adxlen) di_sigLow = adxLow(dilen, adxlen) //plot(ADX_Sig) //ADX Signal A4_red = di_sigLow>di_sigHigh and ADX_Sig>25 ?1:0 A4_blue = di_sigHigh>di_sigLow and ADX_Sig>25 ?1:0 //5. AO ao = sma(hl2,5) - sma(hl2,34) //AO Signal A5_red = ao<0 ?1:0 A5_blue = ao>0 ?1:0 //6. momentum mom = close - close[10] //momentum Signal A6_red = mom<0 ?1:0 A6_blue = mom>0 ?1:0 //7. MACD fast_ma = ema(close, 12) slow_ma = ema(close, 26) macd = fast_ma - slow_ma signal = ema(macd, 9) hist = macd - signal //MACD Signal A7_red = hist < hist[1] ?1:0 A7_blue = hist > hist[1] ?1:0 //8. Stoch RSI rsi1 = rsi(close, 14) rsik = sma(stoch(rsi1, rsi1, rsi1, 14), 3) rsid = sma(rsik, 3) rsih0 = 80 rsih1 = 20 //Stoch RSI Signal A8_red = rsik < rsih1 ?1:0 A8_blue = rsik > rsih0 ?1:0 //9. %R upper = highest(14) lower = lowest(14) out = 100 * (close - upper) / (upper - lower) rband1 = -20 rband0 = -80 // %R Signal A9_red = out < rband0 ?1:0 A9_blue = out > rband1 ?1:0 //10. Bull bear Length = 30 r1=iff(close[1]<open,max(open-close[1],high-low),high-low) r2=iff(close[1]>open,max(close[1]-open,high-low),high-low) bull=iff(close==open,iff(high-close==close-low,iff(close[1]>open,max(high-open,close-low),r1),iff(high-close>close-low,iff(close[1]<open, max(high-close[1],close-low), high-open),r1)),iff(close<open,iff(close[1]<open,max(high-close[1],close-low), max(high-open,close-low)),r1)) bear=iff(close==open,iff(high-close==close-low,iff(close[1]<open,max(open-low,high-close),r2),iff(high-close>close-low,r2,iff(close[1]>open,max(close[1]-low,high-close), open-low))),iff(close<open,r2,iff(close[1]>open,max(close[1]-low,high-close),max(open-low,high-close)))) // Bull bear Signal A10_red = sma(bull-bear,Length)<0 ?1:0 A10_blue = sma(bull-bear,Length)>0 ?1:0 //11.UO length7 = 7, length14 = 14, length28 = 28 average(bp, tr_, length) => sum(bp, length) / sum(tr_, length) high_ = max(high, close[1]) low_ = min(low, close[1]) bp = close - low_ tr_ = high_ - low_ avg7 = average(bp, tr_, length7) avg14 = average(bp, tr_, length14) avg28 = average(bp, tr_, length28) uoout = 100 * (4*avg7 + 2*avg14 + avg28)/7 // UO Signal A11_red = uoout < 30 ?1:0 A11_blue = uoout > 70 ?1:0 //Sum Signal A A_red = A1_red + A2_red + A3_red + A4_red + A5_red + A6_red + A7_red + A8_red + A9_red + A10_red + A11_red A_blue = A1_blue + A2_blue + A3_blue + A4_blue + A5_blue + A6_blue + A7_blue + A8_blue + A9_blue + A10_blue + A11_blue //B. Moving Averages //1. ema 5 B1_red = close<ema(close,5) ?1:0 B1_blue = close>ema(close,5) ?1:0 //2. sma 5 B2_red = close<sma(close,5) ?1:0 B2_blue = close>sma(close,5) ?1:0 //3. ema 10 B3_red = close<ema(close,10) ?1:0 B3_blue = close>ema(close,10) ?1:0 //4. sma 10 B4_red = close<sma(close,10) ?1:0 B4_blue = close>sma(close,10) ?1:0 //5. ema 20 B5_red = close<ema(close,20) ?1:0 B5_blue = close>ema(close,20) ?1:0 //6. sma 20 B6_red = close<sma(close,20) ?1:0 B6_blue = close>sma(close,20) ?1:0 //7. ema 30 B7_red = close<ema(close,30) ?1:0 B7_blue = close>ema(close,30) ?1:0 //8. sma 30 B8_red = close<sma(close,30) ?1:0 B8_blue = close>sma(close,30) ?1:0 //9. ema 50 B9_red = close<ema(close,50) ?1:0 B9_blue = close>ema(close,50) ?1:0 //10. sma 50 B10_red = close<sma(close,50) ?1:0 B10_blue = close>sma(close,50) ?1:0 //11. ema 100 B11_red = close<ema(close,100) ?1:0 B11_blue = close>ema(close,100) ?1:0 //12. sma 100 B12_red = close<sma(close,100) ?1:0 B12_blue = close>sma(close,100) ?1:0 //13. ema 200 B13_red = close<ema(close,200) ?1:0 B13_blue = close>ema(close,200) ?1:0 //14. sma 200 B14_red = close<sma(close,200) ?1:0 B14_blue = close>sma(close,200) ?1:0 //15. Ichimoku Cloud - Baseline donchian(len) => avg(lowest(len), highest(len)) ichi_baseline = donchian(26) B15_red = close<ichi_baseline ?1:0 B15_blue = close>ichi_baseline ?1:0 //16. VWMA 20 B16_red = close<vwma(close,20) ?1:0 B16_blue = close>vwma(close,20) ?1:0 //17. Hull 9 hma(src,len) => wma(2*wma(src, len/2)-wma(src, len), round(sqrt(len))) B17_red = close<hma(close,9) ?1:0 B17_blue = close>hma(close,9) ?1:0 //Sum Signal B B_red = B1_red + B2_red + B3_red + B4_red + B5_red + B6_red + B7_red + B8_red + B9_red + B10_red + B11_red + B12_red + B13_red + B14_red + B15_red + B16_red + B17_red B_blue = B1_blue + B2_blue + B3_blue + B4_blue + B5_blue + B6_blue + B7_blue + B8_blue + B9_blue + B10_blue + B11_blue + B12_blue + B13_blue + B14_blue + B15_blue + B16_blue + B17_blue //C. Pivot /////////////// // FUNCTIONS // /////////////// // Function outputs 1 when it's the first bar of the D/W/M/Y is_newbar(res) => ch = 0 if(res == 'Y') t = year(time('D')) ch := change(t) != 0 ? 1 : 0 else t = time(res) ch := change(t) != 0 ? 1 : 0 ch // Rounding levels to min tick nround(x) => n = round(x / syminfo.mintick) * syminfo.mintick //////////// // INPUTS // //////////// pp_res = 'D' ///////////////////// // Get HLC from HT // // Calc Open open_cur = 0.0 open_cur := is_newbar(pp_res) ? open : open_cur[1] popen = 0.0 popen := is_newbar(pp_res) ? open_cur[1] : popen[1] // Calc High high_cur = 0.0 high_cur := is_newbar(pp_res) ? high : max(high_cur[1], high) phigh = 0.0 phigh := is_newbar(pp_res) ? high_cur[1] : phigh[1] // Calc Low low_cur = 0.0 low_cur := is_newbar(pp_res) ? low : min(low_cur[1], low) plow = 0.0 plow := is_newbar(pp_res) ? low_cur[1] : plow[1] // Calc Close pclose = 0.0 pclose := is_newbar(pp_res) ? close[1] : pclose[1] //////////////////////////// // CALCULATE Pivot POINTS // //////////////////////////// PP = 0.0 R1 = 0.0, R2 = 0.0, R3 = 0.0 S1 = 0.0, S2 = 0.0, S3 = 0.0 //if (pp_type == "Traditional") TR_PP = (phigh + plow + pclose) / 3 TR_R1 = TR_PP + (TR_PP - plow) TR_S1 = TR_PP - (phigh - TR_PP) TR_R2 = TR_PP + (phigh - plow) TR_S2 = TR_PP - (phigh - plow) TR_R3 = phigh + 2 * (TR_PP - plow) TR_S3 = plow - 2 * (phigh - TR_PP) //Signal C1_red = (close<TR_S1 and not cross(close,TR_S2)) or (close<TR_S2 and not cross(close,TR_S3)) or (close<TR_S3 and not cross(high,TR_S3)) ?1:0 C1_blue = (close>TR_R1 and not cross(close,TR_R2)) or (close>TR_R2 and not cross(close,TR_R3)) or (close>TR_R3 and not cross(low,TR_R3)) ?1:0 //if (pp_type == "Fibonacci") FIB_PP = (phigh + plow + pclose) / 3 FIB_R1 = FIB_PP + (phigh - plow) * 0.382 FIB_S1 = FIB_PP - (phigh - plow) * 0.382 FIB_R2 = FIB_PP + (phigh - plow) * 0.618 FIB_S2 = FIB_PP - (phigh - plow) * 0.618 FIB_R3 = FIB_PP + (phigh - plow) * 1.000 FIB_S3 = FIB_PP - (phigh - plow) * 1.000 C2_red = (close<FIB_S1 and not cross(close,FIB_S2)) or (close<FIB_S2 and not cross(close,FIB_S3)) or (close<FIB_S3 and not cross(high,FIB_S3)) ?1:0 C2_blue = (close>FIB_R1 and not cross(close,FIB_R2)) or (close>FIB_R2 and not cross(close,FIB_R3)) or (close>FIB_R3 and not cross(low,FIB_R3)) ?1:0 //if (pp_type == "Woodie") WO_PP = (phigh + plow + 2 * popen) / 4 WO_R1 = WO_PP + (WO_PP - plow) WO_S1 = WO_PP - (phigh - WO_PP) WO_R2 = WO_PP + (phigh - plow) WO_S2 = WO_PP - (phigh - plow) WO_R3 = phigh + 2 * (WO_PP - plow) WO_S3 = plow - 2 * (phigh - WO_PP) C3_red = (close<WO_S1 and not cross(close,WO_S2)) or (close<WO_S2 and not cross(close,WO_S3)) or (close<WO_S3 and not cross(high,WO_S3)) ?1:0 C3_blue = (close>WO_R1 and not cross(close,WO_R2)) or (close>WO_R2 and not cross(close,WO_R3)) or (close>WO_R3 and not cross(low,WO_R3)) ?1:0 //if (pp_type == "Camarilla") CA_PP = (phigh + plow + pclose) / 3 CA_R1 = pclose + (phigh - plow) * 1.1/12 CA_S1 = pclose - (phigh - plow) * 1.1/12 CA_R2 = pclose + (phigh - plow) * 1.1/6 CA_S2 = pclose - (phigh - plow) * 1.1/6 CA_R3 = pclose + (phigh - plow) * 1.1/4 CA_S3 = pclose - (phigh - plow) * 1.1/4 C4_red = (close<CA_S1 and not cross(close,CA_S2)) or (close<CA_S2 and not cross(close,CA_S3)) or (close<CA_S3 and not cross(high,CA_S3)) ?1:0 C4_blue = (close>CA_R1 and not cross(close,CA_R2)) or (close>CA_R2 and not cross(close,CA_R3)) or (close>CA_R3 and not cross(low,CA_R3)) ?1:0 //C Point C_red = C1_red + C2_red + C3_red + C4_red C_blue = C1_blue + C2_blue + C3_blue + C4_blue //Sum point Sum_red=A_red+B_red+C_red Sum_blue=A_blue+B_blue+C_blue sell_point=(Sum_red/32)*100 buy_point=(Sum_blue/32)*100 //Trade Zone sellzone = A_red>A_blue and B_red>B_blue and C_red>C_blue and sell_point>50 and close>open and not crossunder(sell_point,75) buyzone = A_red<A_blue and B_red<B_blue and C_red<C_blue and buy_point>50 and close<open and not crossunder(buy_point,75) // - /FUNCTIONS xTech= sellzone yTech= buyzone //--------------------------------------\\ // - /FUNCTIONS //--------------------------------------\\ //plot h100=hline(100) h0=hline(0) col_sell=xTech?color.new(color.red,10):color.new(color.red,60) col_buy=yTech?color.new(color.blue,10):color.new(color.blue,60) plot(sell_point, title="Sell Level", style=plot.style_columns, color=col_sell) plot(buy_point, title="Buy Level", style=plot.style_columns, color=col_buy) //Alert CputcolDvM = xTech? color.red : na CcallcolDvM = yTech? color.blue : na //plotshape(CTimeDvM?t0_DvM?xTech:na:na, title='Put', text="Put", style=shape.labeldown, location=location.bottom, color=color.orange, textcolor=color.black, offset=1, transp=0) //plotshape(CTimeDvM?t0_DvM?yTech:na:na, title='Call', text="Call", style=shape.labelup, location=location.bottom, color=color.orange, textcolor=color.black, offset=1, transp=0) //bgcolor(CTimeDvM?t0_DvM?CputcolDvM:na:na, transp=0, offset=1, title="Put Signal") //bgcolor(CTimeDvM?t0_DvM?CcallcolDvM:na:na, transp=0, offset=1, title="Call Signal") PutSignal=CTimeDvM?t0_DvM?xTech?-100:na:na:na CallSignal=CTimeDvM?t0_DvM?yTech?-100:na:na:na hmacro=hline(-100) plot(PutSignal, title='Put Signal', style=plot.style_columns, color=color.red, offset=0, transp=0,show_last=1) plot(CallSignal, title='Call Signal', style=plot.style_columns, color=color.blue, offset=0, transp=0,show_last=1) plotshape(PutSignal, title='Put', text="Put", style=shape.labeldown, location=location.bottom, color=color.orange, textcolor=color.black, offset=0, transp=0,show_last=1) plotshape(CallSignal, title='Call', text="Call", style=shape.labelup, location=location.bottom, color=color.orange, textcolor=color.black, offset=0, transp=0,show_last=1) sell_point_text = tostring(sell_point) buy_point_text = tostring(buy_point) label_sell_point = label.new(bar_index, sell_point, text=sell_point_text, style= label.style_none) label.delete(label_sell_point[1]) label_buy_point = label.new(bar_index, buy_point, text=buy_point_text, style= label.style_none) label.delete(label_buy_point[1]) //EOF
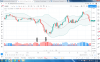
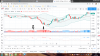
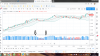
=== Ảnh minh họa ===

vntrading trong Tự Giới Thiệu Sản Phẩm - Dịch Vụ Dành Cho Trader
3,171 Xem / 18 Trả lời

