anhnguyen14
Active Member
- 24,370
- 30,839
hic, có lệnh đâu mà cháy vậyhic e cháy rồi huhu


hic, có lệnh đâu mà cháy vậyhic e cháy rồi huhu
hôm qua lãi 40utin hôm nay lênh level 4 thấy thông báo tinh tinh nhiều quá ra mở chart ngứa tay bấm nhầm phát huhu chán luôn keke lại demo tiếp thôi@vĩnh0902 dự trữ 114 unit, mất 16 unit thì vẫn không bao nhiêu mà, hôm nay loss level 3 thôi chứ, sao để cháy luôn òi, hic, buồn quá, hôm trước mình mới cháy, nay tới vĩnh cháy, hic, chia buồn nha. Demo tiếp đi vĩnh, real để mình. Tk này mới loss 12 unit thôi (hôm qua lãi 4.49 unit)
cứ có code mới là y như quy luật keke cháy tài khoản thấy bác post code mới.@vĩnh0902 hết giờ, hihih, hôm nay stoploss 16 unit, kaka, Vĩnh kiểm tra giúp mình em woodies này chuỗi loss ở 5000 bars trước có nhiều không nha, chứ 5000 bars hiện tại khá tốt, kể cả hôm nay, nếu chạy code này thì hôm nay ko có stoploss mà là take profit level 5 luôn đấy
Mã:// BO - Woodies CCI - Backtesting // © inno14 //@version=4 strategy("BO - Woodies CCI - Backtesting") //strategy.risk.max_intraday_loss(1, strategy.cash) // === INPUT PERIOD OF TIME === Date = input(true, title = "=== Date Option ===") FromDay = input(defval = 1, title = "From Day", minval = 1, maxval = 31) FromMonth = input(defval = 1, title = "From Month", minval = 1, maxval = 12) FromYear = input(defval = 2020, title = "From Year", minval = 2017) ToDay = input(defval = 1, title = "To Day", minval = 1, maxval = 31) ToMonth = input(defval = 1, title = "To Month", minval = 1, maxval = 12) ToYear = input(defval = 9999, title = "To Year", minval = 2017) // === DATE RANGE === start = timestamp(FromYear, FromMonth, FromDay, 00, 00) // backtest start window finish = timestamp(ToYear, ToMonth, ToDay, 23, 59) // backtest finish window window() => time >= start and time <= finish ? true : false // create function "within window of time" // === Trading Time === CTimeDvM = input(true, title = "=== Trading Time ===") Time_zone = input(7,title="Time Zone") FromHourDvM = input(defval = 07, title = "From Hour", minval = 00, maxval = 23) FromMinuteDvM = input(defval = 30, title = "From Minute", minval = 00, maxval = 59) ToHourDvM = input(defval = 18, title = "To Hour", minval = 00, maxval = 23) ToMinuteDvM = input(defval = 00, title = "To Minute", minval = 00, maxval = 59) GMT_FHDvM=FromHourDvM<Time_zone?FromHourDvM-Time_zone+24:FromHourDvM-Time_zone GMT_THDvM=ToHourDvM<Time_zone?ToHourDvM-Time_zone+24:ToHourDvM-Time_zone fhDvM= (GMT_FHDvM<10?"0"+tostring(GMT_FHDvM):tostring(GMT_FHDvM)) fmDvM= (FromMinuteDvM<10?"0"+tostring(FromMinuteDvM):tostring(FromMinuteDvM)) thDvM= (GMT_THDvM<10?"0"+tostring(GMT_THDvM):tostring(GMT_THDvM)) tmDvM= (ToMinuteDvM<10?"0"+tostring(ToMinuteDvM):tostring(ToMinuteDvM)) WorkingHourDvM = fhDvM+fmDvM+"-"+thDvM+tmDvM t0_DvM = time(timeframe.period, WorkingHourDvM) htrtime = input(true,title="Highlight Trading Time") bgcolor(htrtime? t0_DvM? color.gray : na:na, title="Trading Time", transp=90) // //Woodies CCI cciTurboLength = input(title="CCI Turbo Length", type=input.integer, defval=6, minval=3, maxval=1400) cci14Length = input(title="CCI 14 Length", type=input.integer, defval=14, minval=7, maxval=2000) source = close cciTurbo = cci(source, cciTurboLength) cci14 = cci(source, cci14Length) last5IsDown = cci14[5] < 0 and cci14[4] < 0 and cci14[3] < 0 and cci14[2] < 0 and cci14[1] < 0 last5IsUp = cci14[5] > 0 and cci14[4] > 0 and cci14[3] > 0 and cci14[2] > 0 and cci14[1] > 0 histogramColor = last5IsUp ? color.green : last5IsDown ? color.red : cci14 < 0 ? color.gray : color.gray //Plot Woodies CCI plot(cci14, title="CCI Histogram", color=histogramColor, style=plot.style_histogram, linewidth=2, transp=40) plot(0, title="Zero Line", color=cciTurbo>100?color.blue:cciTurbo<-100?color.red:color.navy, style=plot.style_line, linewidth=6, transp=20) hline(200, title="Hundred Line", color=color.black, linestyle=hline.style_dotted) hline(-200, title="Minus Line", color=color.black, linestyle=hline.style_dotted) //Plot lingreg CCI14 linreg_cci14=linreg(cci14, 5, 0) plot(linreg_cci14, color=color.aqua, linewidth=4) // ext_linreg=input(150,title="Extreme Level") //peak & top peak_cci= linreg_cci14[2]>linreg_cci14[3] and linreg_cci14[1]>linreg_cci14[2] and linreg_cci14[0]<linreg_cci14[1] and linreg_cci14[1]>ext_linreg bott_cci= linreg_cci14[2]<linreg_cci14[3] and linreg_cci14[1]<linreg_cci14[2] and linreg_cci14[0]>linreg_cci14[1] and linreg_cci14[1]<-ext_linreg peak_cci_1= linreg_cci14[2]>linreg_cci14[3] and linreg_cci14[1]>linreg_cci14[2] and linreg_cci14[0]<linreg_cci14[1] bott_cci_1= linreg_cci14[2]<linreg_cci14[3] and linreg_cci14[1]<linreg_cci14[2] and linreg_cci14[0]>linreg_cci14[1] // fil_len=input(6,title="Filter Length") top_ext=highest(linreg_cci14,fil_len) bot_ext=lowest(linreg_cci14,fil_len) //Put signal x1= peak_cci and linreg_cci14[1]==top_ext and linreg_cci14[1]>valuewhen(peak_cci_1,linreg_cci14[1],1) and close>low[1] and cci14<linreg_cci14 //Call signal y1= bott_cci and linreg_cci14[1]==bot_ext and linreg_cci14[1]<valuewhen(bott_cci_1,linreg_cci14[1],1) and close<high[1] and cci14>linreg_cci14 no_orders = not strategy.opentrades //Function xTech= x1 and no_orders yTech= y1 and no_orders //Plot Analyzing Signals //hline1=hline(-1.2*300) hline2=hline(-1.6*300) hline0=hline(0) sigtext= xTech?"Put signal":yTech?"Call signal": "Backtesting From: "+tostring(FromDay)+"/"+tostring(FromMonth)+"/"+tostring(FromYear)+" To: "+tostring(ToDay)+"/"+tostring(ToMonth)+"/"+tostring(ToYear) + " * Trading Time From: "+tostring(FromHourDvM)+":"+tostring(FromMinuteDvM)+" To "+tostring(ToHourDvM)+":"+tostring(ToMinuteDvM) sig_col=xTech?color.new(color.red,10):yTech?color.new(color.blue,10):color.new(color.navy,10) label_sig_text = label.new(bar_index[0], -1.5*300, text=sigtext, style=label.style_none, textcolor=sig_col, size=size.large) label.delete(label_sig_text[1]) //plot Signal putcol = xTech? color.red : na callcol = yTech? color.blue : na PutSignal= xTech and window() and t0_DvM?-1.2*300:na CallSignal= yTech and window() and t0_DvM?-1.2*300:na //plot(PutSignal, title='Put Signal', style=plot.style_columns, color=color.red, offset=1, transp=0) //plot(CallSignal, title='Call Signal', style=plot.style_columns, color=color.blue, offset=1, transp=0) plotshape(PutSignal, title='Put', text="Put", style=shape.circle, location=location.absolute, color=color.red, textcolor=color.black, offset=1, transp=0, size=size.large) plotshape(CallSignal, title='Call', text="Call", style=shape.circle, location=location.absolute, color=color.blue, textcolor=color.black, offset=1, transp=0, size=size.large) //plotchar(PutSignal, title='Put', char="◉", text="Put", location=location.absolute, color=color.red, textcolor=color.black, offset=1, transp=0, size=size.small) //plotchar(CallSignal, title='Call', char="◉", text="Call", location=location.absolute, color=color.blue, textcolor=color.black, offset=1, transp=0, size=size.small) //Backtesting exp_tt=input(true,"Expiry Option By Bars") exp_val=input(3,"Number of Bars") strategy.entry("Call", strategy.long, when=yTech and window() and t0_DvM) strategy.entry("Put", strategy.short, when=xTech and window() and t0_DvM) strategy.close_all(when=barssince(xTech)==exp_val or barssince(yTech)==exp_val) //EOF
Đừng để tay bấm, tập cho macro chạy, tuyệt đối ko mó tay vào, mất lãi còn gốc mà, hic, kiểm tra giúp mình cái code trên nha, tk mình hôm nay loss level 3, vẫn còn cả đống unit, tuàn sau chiến một mình vậy, vĩnh demo thuihôm qua lãi 40utin hôm nay lênh level 4 thấy thông báo tinh tinh nhiều quá ra mở chart ngứa tay bấm nhầm phát huhu chán luôn keke lại demo tiếp thôi
Đừng để tay bấm, tập cho macro chạy, tuyệt đối ko mó tay vào, mất lãi còn gốc mà, hic, kiểm tra giúp mình cái code trên nha, tk mình hôm nay loss level 3, vẫn còn cả đống unit, tuàn sau chiến một mình vậy, vĩnh demo thui
ngồi k k chịu dkVẫn code cũ chỉ bỏ bớt đk ràng buộc của cciTourbo thôi. Bớt điều kiện, lệnh nhiều hơn, hiệu suất cao hơn, ko biết tháng trước thế nào.cứ có code mới là y như quy luật keke cháy tài khoản thấy bác post code mới.
mình có kiểm tra thì tháng trước có 1 chuổi lost 6 và chuổi lost 4 nha. Nếu bỏ qua cái đó thì khá ngon đó chứ, 2 tháng mà 220 lệnhVẫn code cũ chỉ bỏ bớt đk ràng buộc của cciTourbo thôi. Bớt điều kiện, lệnh nhiều hơn, hiệu suất cao hơn, ko biết tháng trước thế nào.
Chuỗi loss 6 xảy ra trong 1 ngày hay >1 ngày vậy bạn Nhật, nếu >1 ngày thì ko vấn đềmình có kiểm tra thì tháng trước có 1 chuổi lost 6 và chuổi lost 4 nha. Nếu bỏ qua cái đó thì khá ngon đó chứ, 2 tháng mà 220 lệnh
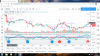
đay ne bác ơi hjhjChuỗi loss 6 xảy ra trong 1 ngày hay >1 ngày vậy bạn Nhật, nếu >1 ngày thì ko vấn đề
trước đó là ngày 22 cũng 3 los liên tiếp hơi căng nếu tính ngày 23 thì 5 loss liên tiếpđay ne bác ơi hjhj
Á đù, 5 lệnh đỏ trong 1 ngày, sự kiện này liệu có lặ lại, để mình note lên bảng xem lần tới chuỗi 5 loss intraday nó cách mốc này bao xa, và lợi nhuận nếu có thì có bù đắp được cho rủi ro ko, tks 2 bạn nha. Về số lệnh và hiệu suất thì quá ổn rùi, tuần sau mình sẽ chạy nó.đay ne bác ơi hjhj
Nếu có 1 lệnh win gối đầu trước đó thì ko sao, vì đến lệnh số 4 mới phải đi vốn loss level 2, tính ra chẳng mất bao nhiu unit
trước đó là ngày 22 cũng 3 los liên tiếp hơi căng nếu tính ngày 23 thì 5 loss liên tiếp
tks, hy vọng 2 ngày cuối tuần mình khắc phục được nó mà ko đánh mất quá nhiều lệnhlích sử thi 5 loss 1 ngày trên chart thi 6 lênh bác ơi hic
sử dụng quản lí vốn z e vẫn run có nhieu chuỗi win mà chưa tận dụng đk bác ạ hjhjtks, hy vọng 2 ngày cuối tuần mình khắc phục được nó mà ko đánh mất quá nhiều lệnh
cố lên bác,tks, hy vọng 2 ngày cuối tuần mình khắc phục được nó mà ko đánh mất quá nhiều lệnh
sử dụng quản lí vốn z e vẫn run có nhieu chuỗi win mà chưa tận dụng đk bác ạ hjhj
haiz, nói ko phải xui, bác còn run thì nghỉ đánh thôi, đánh gấp lệnh nó thực sự rất tâm lý luônsử dụng quản lí vốn z e vẫn run có nhieu chuỗi win mà chưa tận dụng đk bác ạ hjhj
haha cứ đến lệnh to hên xui giã man tâm lí k như lúc binh thường đk thật là khócố lên bác,
haiz, nói ko phải xui, bác còn run thì nghỉ đánh thôi, đánh gấp lệnh nó thực sự rất tâm lý luôn
lệnh nhỏ ko nói, nếu bác rèn đc lúc đi lệnh lớn mà dứt khoát thì cứ gấp lệnh. Còn ko dứt khoát thì bỏ thôi, chứ ko lại gặp tình trạng lệnh ăn ko vào, lại vào lệnh thuahaha cứ đến lệnh to hên xui giã man tâm lí k như lúc binh thường đk thật là khó
We get it, advertisements are annoying!
Sure, ad-blocking software does a great job at blocking ads, but it also blocks useful features of our website. For the best site experience please disable your AdBlocker.
Tất cả nội dung trên website này đều vì mục đích cung cấp thông tin và không phải lời khuyên đầu tư.
Tại Việt Nam, giao dịch CFD forex có các rủi ro nhất định, trong đó bao gồm rủi ro về pháp lý. Độc giả nên tìm hiểu kỹ trước khi đưa ra quyết định tham gia.